
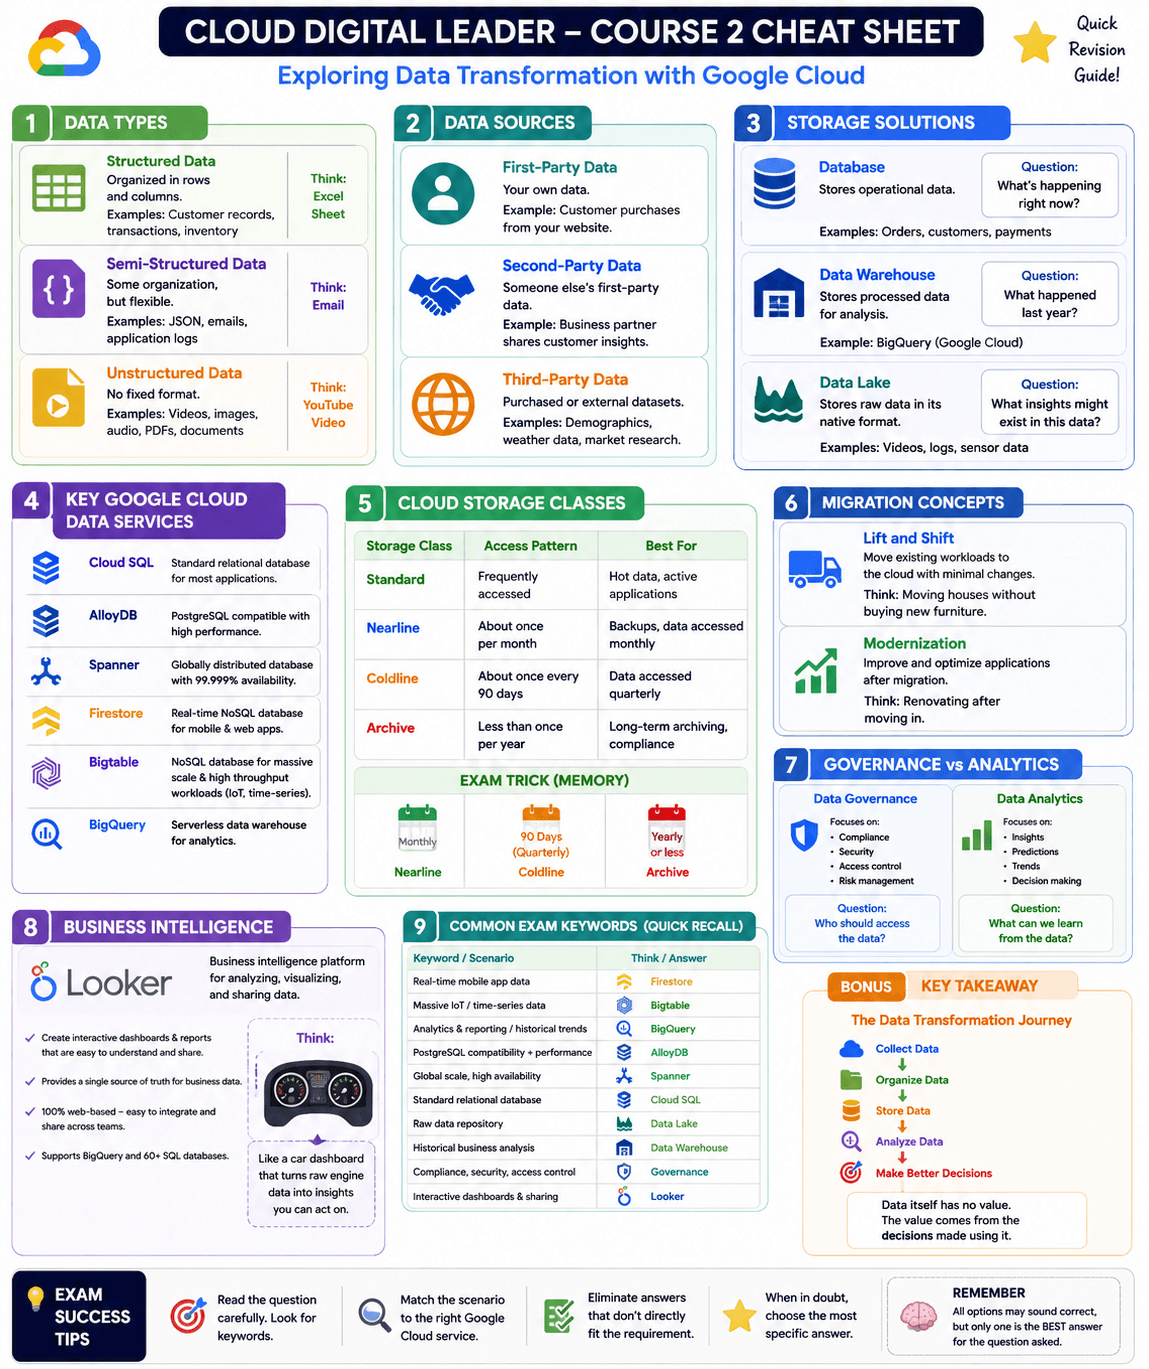
Over the last few lessons, I’ve learned about:
- Databases
- Data Lakes
- Data Warehouses
- Cloud Storage
- Database Migration
At one point I stopped and thought:
“Okay, the company has collected the data.”
“The data is organized.”
“The data is stored safely.”
Now what?
Because honestly, data sitting in storage isn’t helping anyone.
A company doesn’t become successful because it has data.
It becomes successful because it can make better decisions using that data.
And that’s where today’s lesson finally connected all the puzzle pieces.
The Spreadsheet Problem
Imagine a company with thousands of employees.
Sales teams have data.
Marketing teams have data.
Finance teams have data.
Operations teams have data.
Everyone has information.
But everyone is looking at a different version of reality.
One team uses Excel.
Another team builds reports.
Another team creates dashboards.
Soon people start asking:
“Whose numbers are correct?”
And that’s where businesses get into trouble.
Because decisions start getting based on opinions instead of facts.
Data Is Useless If Nobody Can Understand It
This was probably my biggest takeaway today.
Having data isn’t enough.
People need a way to:
- Explore it
- Understand it
- Share it
- Make decisions from it
Otherwise, the data simply becomes expensive storage.
Enter Looker
Today’s lesson introduced Looker.
At first, I thought it was another database product.
But it isn’t.
Looker doesn’t exist to store data.
Looker exists to help people understand data.
Think of it as a translator.
The database speaks in rows, columns, and SQL queries.
Business users speak in questions like:
- Which product sold best?
- Why are sales dropping?
- Which region is growing fastest?
- What should we do next?
Looker helps bridge that gap.
The Dashboard Analogy
Imagine driving a car.
The engine generates a huge amount of information.
But you don’t open the engine every five minutes.
Instead, you look at the dashboard.
The dashboard tells you:
- Speed
- Fuel level
- Engine warnings
In a similar way, Looker creates dashboards that help organizations understand what’s happening without digging directly into databases.
Why Businesses Need a Single Source of Truth
One example in the course described an organization where every department had its own reports and spreadsheets.
That sounds harmless.
But think about the problems it creates:
- Different reports
- Different calculations
- Different definitions
- Different answers
Eventually nobody knows which numbers to trust.
Looker helps create a single source of truth.
Everyone looks at the same data.
Everyone uses the same metrics.
Everyone makes decisions using the same information.
Then I Realized Something…
While learning about dashboards, another question came to mind.
“How does Looker get real-time information?”
After all, if a dashboard shows today’s sales, current website traffic, or live customer activity, where is that data coming from?
That question led me to the next concept:
Streaming Analytics.
Why Waiting Until Tomorrow Isn’t Always Good Enough
Imagine you’re running a food delivery company.
Every second:
- Customers place orders
- Restaurants accept requests
- Delivery partners update locations
- Payments are processed
Would you wait until tomorrow morning to analyze all that information?
Probably not.
If a payment system fails or a restaurant suddenly becomes overwhelmed, you need to know immediately.
That’s why modern businesses use streaming analytics.
Instead of analyzing data hours later, they analyze it while it’s being generated.
The Simple Pipeline That Made It Click
The course introduced several products, but I found it easier to think about them as a simple journey.
Step 1: Events Are Generated
Examples:
- Website clicks
- Food orders
- GPS updates
- Sensor readings
Step 2: Pub/Sub Receives the Events 📨
Think of Pub/Sub as a giant mailbox.
Millions of messages can arrive every second.
Its job is simple:
Receive incoming events.
Step 3: Dataflow Processes the Data 🚚
Now someone needs to organize those messages.
That’s where Dataflow comes in.
It transforms, cleans, and moves the data to the right destination.
Think of it as a delivery truck sorting packages before they reach their final destination.
Step 4: BigQuery Analyzes the Data 📊
After the data is organized, BigQuery helps analyze it.
Questions like:
- What products are trending?
- Which locations generate the most sales?
- Which customer behaviors are changing?
can now be answered.
Step 5: Looker Visualizes the Results 📈
Finally, Looker turns all that information into dashboards and reports that humans can actually understand.
And suddenly all those millions of clicks, orders, and transactions become useful business insights.
The Memory Trick I’m Keeping
Whenever I see these products, I remember this flow:
Pub/Sub → Receive
⬇️
Dataflow → Transform
⬇️
BigQuery → Analyze
⬇️
Looker → Visualize
A Small Exam Lesson I Learned
One of the practice questions asked:
What Looker feature simplifies workflow integration and data sharing across teams?
Several answers looked correct.
But only one directly answered the question:
✅ A 100% web-based platform
That reminded me of something important:
In the Cloud Digital Leader exam, multiple answers may sound true.
The goal is to identify the answer that best solves the specific problem being described.
My Biggest Takeaway
At the beginning of this course, I thought data transformation was mostly about storage.
Today I realized something much bigger.
The goal isn’t collecting data.
The goal isn’t storing data.
The goal isn’t even analyzing data.
The real goal is helping people make better decisions.
And that only happens when data can move from raw events to meaningful insights.
For me, today’s lesson completed the picture:
Collect Data
⬇️
Store Data
⬇️
Organize Data
⬇️
Analyze Data
⬇️
Visualize Data
⬇️
Make Better Decisions
That’s where the real value of data lives.